The event weather console.
HeatTrackR is built for people running a race or outdoor event, not for browsing a forecast at home. These are the surfaces you use after you sign in.
Dashboard
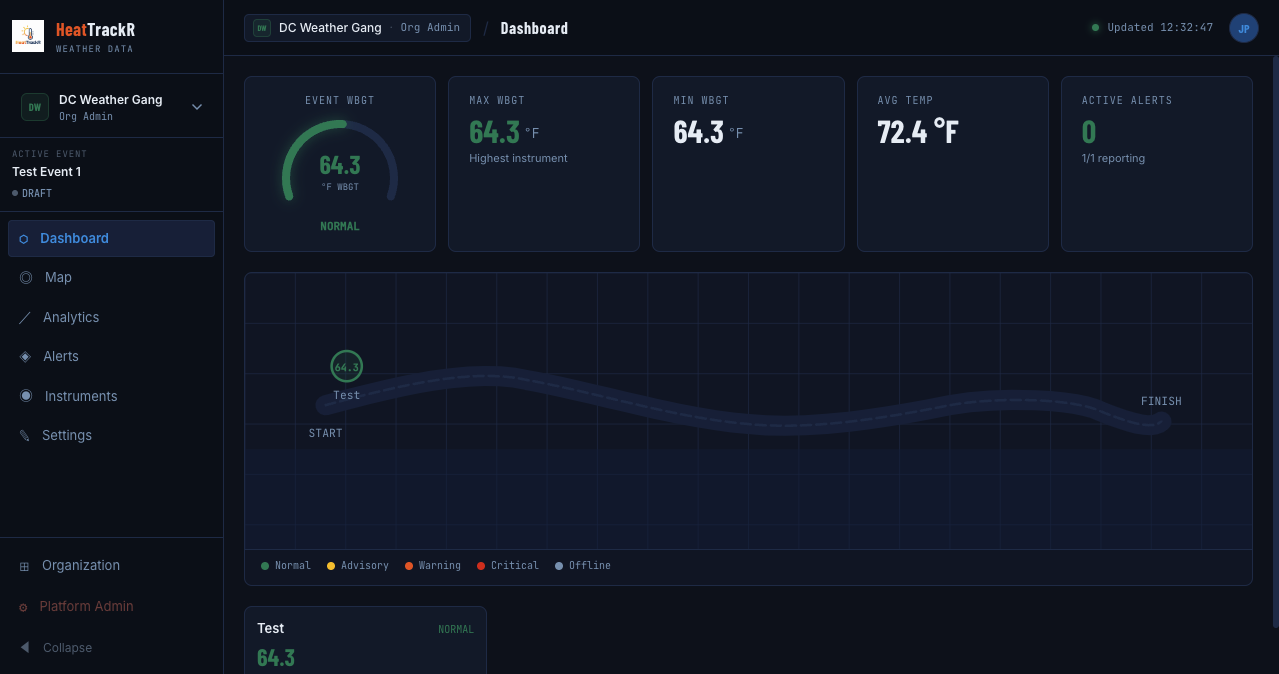
The event home screen. A WBGT gauge, max and average, instrument cards with freshness, a compact NWS forecast strip, and a heat-warning banner when alerts are active. This is the screen medical and ops staff keep open.
Map
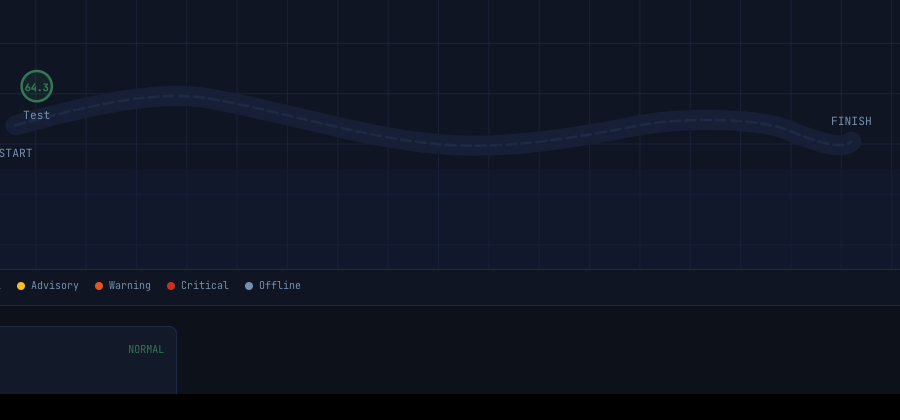
A dark MapLibre view of the event. Instruments and NWS stations are marked and colored by alert state and freshness. Upload up to twelve KML or GeoJSON overlays — course lines, zones, landmarks — from tools such as Google Earth or RideWithGPS.
Instruments
Register on-site devices (the UI defaults to a Kestrel 5400FW), issue a one-time bearer token, and assign the instrument to an event. The table shows WBGT, temperature, humidity, wind, and whether the station is current, delayed, or offline.
Instruments in more detail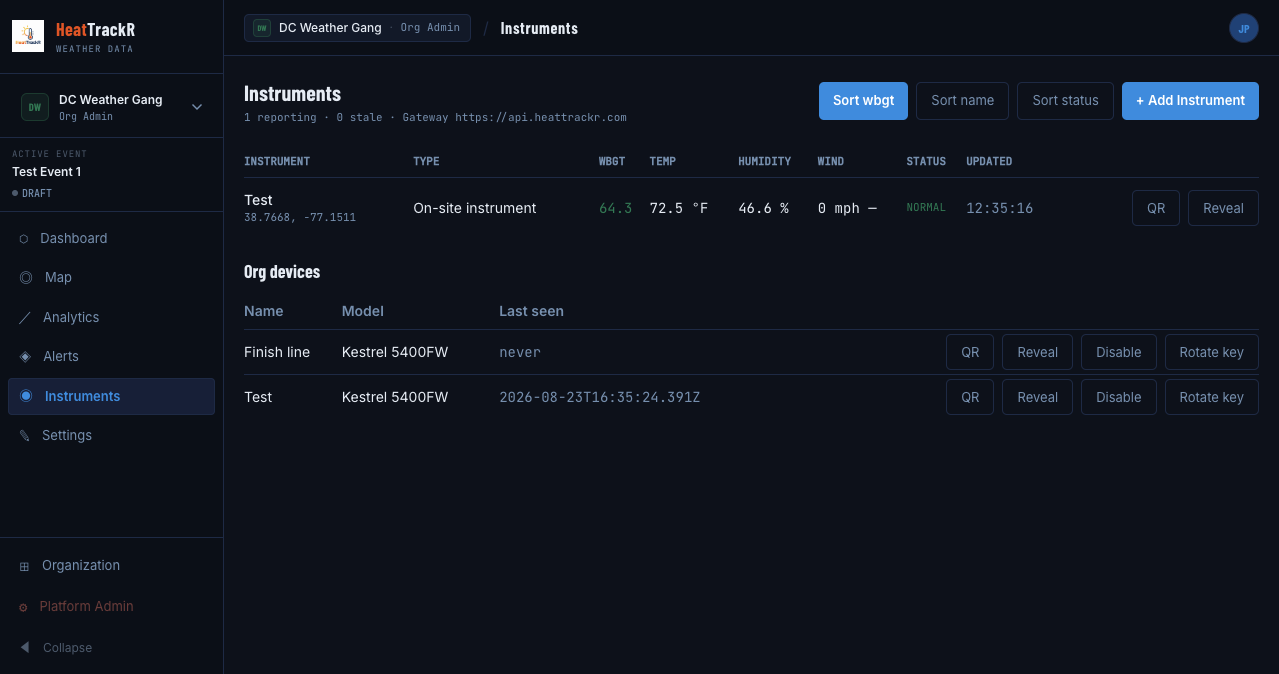
Alerts
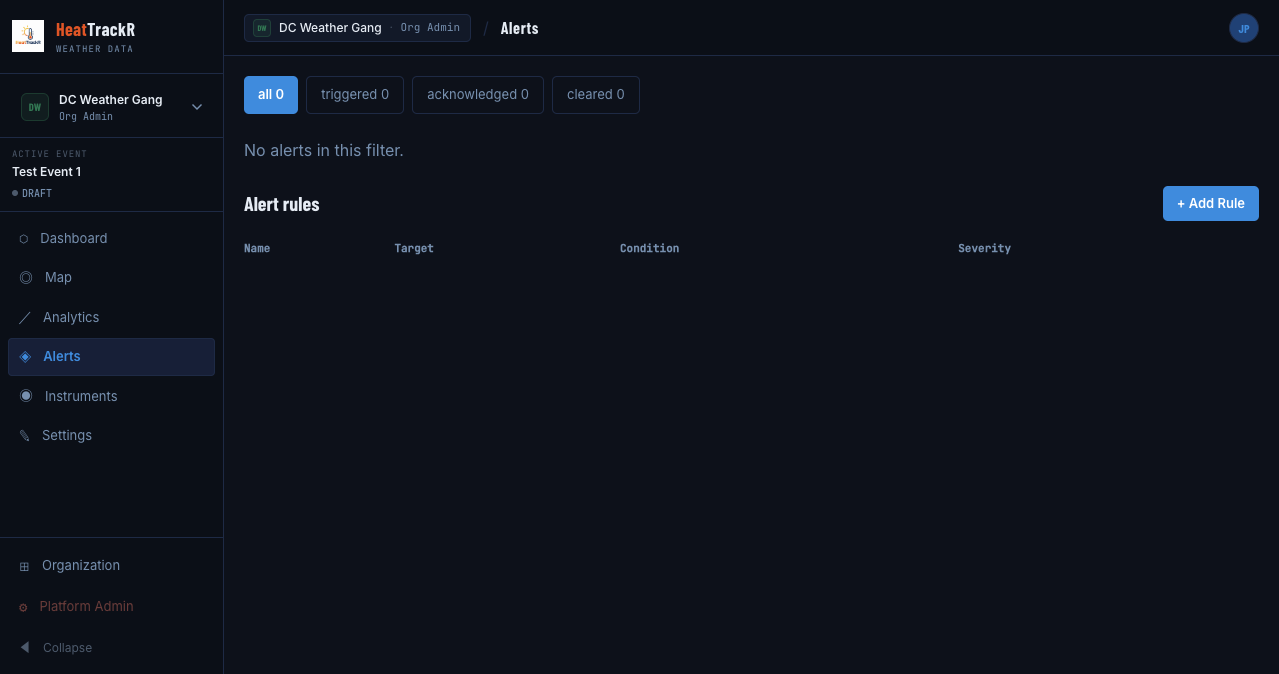
Rules on WBGT or other metrics: greater than, less than, or between. Target a specific instrument, any instrument, the event average, max, min, the forecast, or a stale/offline station. Severities are information, advisory, warning, and critical. You can require a condition to hold for a duration before it fires, and set a different clear threshold. When a rule fires, staff acknowledge it in the same console. HeatTrackR does not send SMS, push, or alert email.
Analytics and export
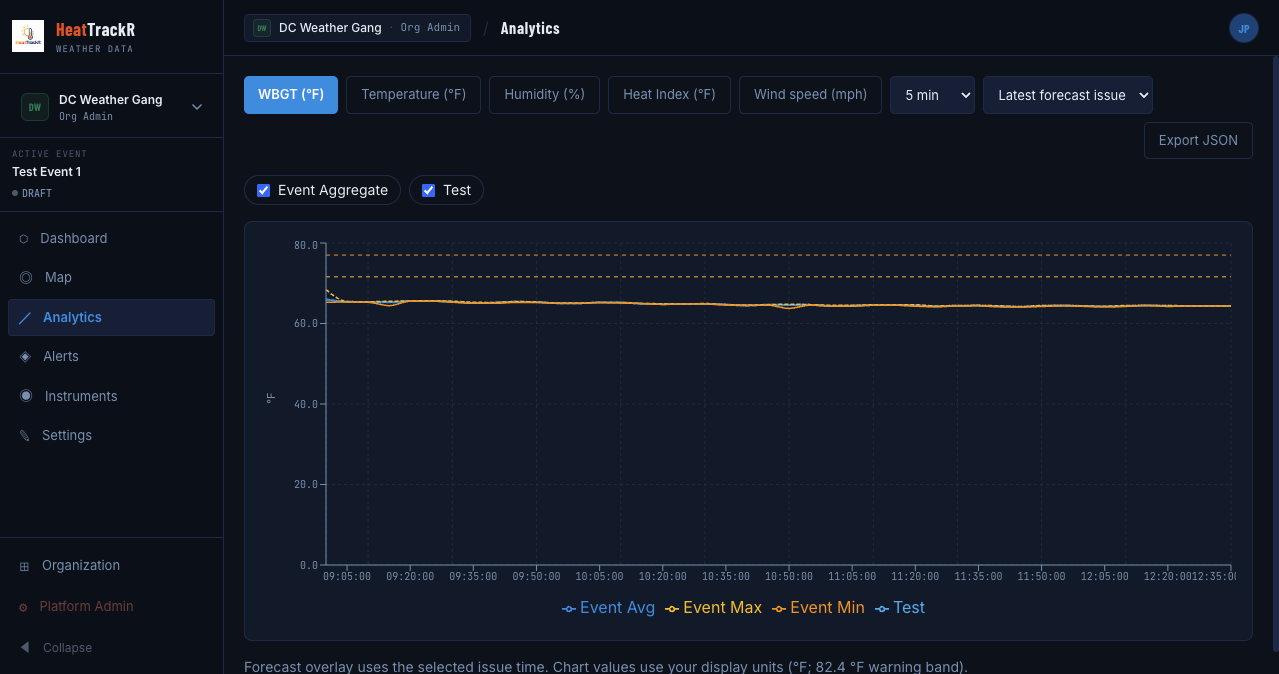
Line charts for WBGT, temperature, humidity, heat index, and wind. Choose raw samples or 1-, 5-, 15-, 30-minute, or hourly rolls. Toggle sources, overlay forecast by issue time, and export a JSON bundle of the event — observations, forecasts, rules, and alerts.
Organizations and roles
An organization holds members and events. Roles are org admin, event admin, and event viewer. Members can be limited to specific events. Operational screens are behind a sign-in — there is no anonymous public or embeddable console. An organization owner may choose to publish event weather; that is described in the Data Ownership policy.
Not in this version
- Outbound paging — no SMS, push, or alert email. Acknowledgments happen in the app.
- Anonymous public or embeddable dashboards. Staff need an account for the console. Publishing event weather is an organization-owner choice described in the Data Ownership policy.
- Native mobile apps. HeatTrackR is a web console.
- Weather sources outside the U.S. National Weather Service.
- CSV or PDF export. The archive export is JSON.
Open the console.
Create an account, verify your email, and set up an organization. There is no sales form in front of the app.